
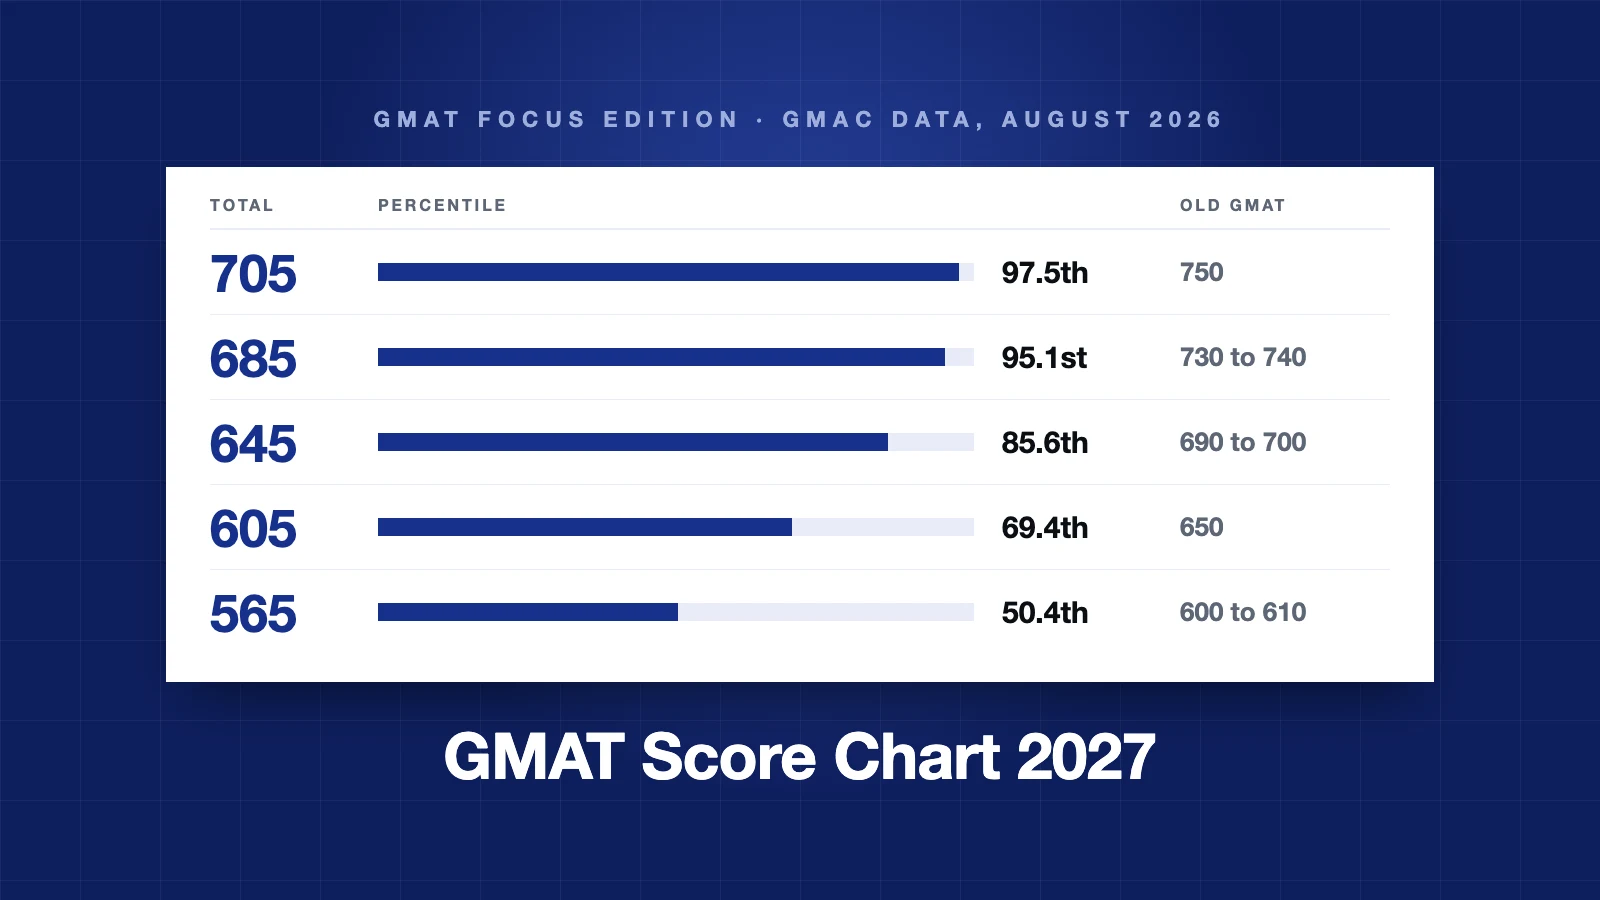
This GMAT score chart lists every total score from 205 to 805 with its percentile, the section scores it takes, and its equivalent on the old 200 to 800 GMAT, followed by the percentile for every Quant, Verbal and Data Insights score. The figures come from GMAC's concordance tables published in August 2026, covering test takers from July 2021 to June 2026 (GMAC, 2026), so they apply to anyone taking the GMAT or applying to business school in 2027. To turn your own section scores into a total, use the GMAT score calculator.
Key Takeaways
- 565 is the 50.4th percentile, 645 the 85.6th, 685 the 95.1st and 705 the 97.5th on GMAC's August 2026 table.
- Every total ends in 5, so there is no 700: the nearest scores are 695 (96.9th percentile) and 705 (97.5th).
- The same section score ranks differently by section: an 80 is the 63.9th percentile in Quant, the 54.4th in Verbal and about the 83rd in Data Insights.
- Compare old and new GMAT scores by percentile, never number for number: a 705 sits where a 750 did.
How is the GMAT Focus Edition scored?
The exam has three sections, Quantitative Reasoning, Verbal Reasoning and Data Insights, each scored from 60 to 90. Your total runs from 205 to 805 in steps of 10 and always ends in 5, so it can never be confused with a score from the old exam (GMAC, 2026).
The three sections count equally towards the total (mba.com, 2026). That makes the sum of your section scores, between 180 and 270, the number that drives your total. GMAC does not publish the exact conversion, but reported scores follow a steady pattern: every 3 section points add 20 to the total. The chart below uses that pattern for its section columns.
GMAT score chart: total scores and percentiles
For each total: its percentile, the smallest section sum that reaches it, one even split of that sum, and the old GMAT scores at the same percentile.
| Total | Percentile | Section sum needed | Even split (Q/V/DI) | Old GMAT equivalent |
|---|---|---|---|---|
| 805 | 100.0 | 270 | 90/90/90 | 790 to 800 |
| 795 | 100.0 | 268 | 90/89/89 | 790 |
| 785 | 100.0 | 267 | 89/89/89 | 780 to 790 |
| 775 | 100.0 | 265 | 89/88/88 | 780 |
| 765 | 99.9 | 264 | 88/88/88 | 780 |
| 755 | 99.8 | 262 | 88/87/87 | 770 to 780 |
| 745 | 99.6 | 261 | 87/87/87 | 770 |
| 735 | 99.4 | 259 | 87/86/86 | 760 to 770 |
| 725 | 98.9 | 258 | 86/86/86 | 760 |
| 715 | 98.6 | 256 | 86/85/85 | 750 to 760 |
| 705 | 97.5 | 255 | 85/85/85 | 750 |
| 695 | 96.9 | 253 | 85/84/84 | 740 to 750 |
| 685 | 95.1 | 252 | 84/84/84 | 730 to 740 |
| 675 | 94.0 | 250 | 84/83/83 | 720 to 730 |
| 665 | 91.2 | 249 | 83/83/83 | 710 to 720 |
| 655 | 89.6 | 247 | 83/82/82 | 700 to 710 |
| 645 | 85.6 | 246 | 82/82/82 | 690 to 700 |
| 635 | 80.9 | 244 | 82/81/81 | 680 to 690 |
| 625 | 78.2 | 243 | 81/81/81 | 680 |
| 615 | 75.4 | 241 | 81/80/80 | 650 to 680 |
| 605 | 69.4 | 240 | 80/80/80 | 650 |
| 595 | 66.3 | 238 | 80/79/79 | 640 to 650 |
| 585 | 59.9 | 237 | 79/79/79 | 620 to 640 |
| 575 | 56.7 | 235 | 79/78/78 | 610 to 620 |
| 565 | 50.4 | 234 | 78/78/78 | 600 to 610 |
| 555 | 47.4 | 232 | 78/77/77 | 580 to 600 |
| 545 | 41.7 | 231 | 77/77/77 | 570 to 580 |
| 535 | 39.1 | 229 | 77/76/76 | 560 to 570 |
| 525 | 34.0 | 228 | 76/76/76 | 550 to 560 |
| 515 | 31.6 | 226 | 76/75/75 | 530 to 550 |
| 505 | 27.3 | 225 | 75/75/75 | 530 |
| 495 | 25.4 | 223 | 75/74/74 | 500 to 530 |
| 485 | 21.7 | 222 | 74/74/74 | 490 to 500 |
| 475 | 20.1 | 220 | 74/73/73 | 470 to 490 |
| 465 | 17.1 | 219 | 73/73/73 | 460 to 470 |
| 455 | 15.7 | 217 | 73/72/72 | 450 to 460 |
| 445 | 13.2 | 216 | 72/72/72 | 440 to 450 |
| 435 | 12.1 | 214 | 72/71/71 | 410 to 440 |
| 425 | 10.2 | 213 | 71/71/71 | 400 to 410 |
| 415 | 9.3 | 211 | 71/70/70 | 380 to 400 |
| 405 | 7.7 | 210 | 70/70/70 | 370 to 380 |
| 395 | 7.0 | 208 | 70/69/69 | 350 to 370 |
| 385 | 5.8 | 207 | 69/69/69 | 350 |
| 375 | 5.2 | 205 | 69/68/68 | 320 to 350 |
| 365 | 4.3 | 204 | 68/68/68 | 310 to 320 |
| 355 | 3.9 | 202 | 68/67/67 | 300 to 310 |
| 345 | 3.1 | 201 | 67/67/67 | 280 to 300 |
| 335 | 2.8 | 199 | 67/66/66 | 250 to 280 |
| 325 | 2.2 | 198 | 66/66/66 | 250 |
| 315 | 2.0 | 196 | 66/65/65 | 240 to 250 |
| 305 | 1.5 | 195 | 65/65/65 | 230 to 240 |
| 295 | 1.3 | 193 | 65/64/64 | 220 to 230 |
| 285 | 1.0 | 192 | 64/64/64 | 210 to 220 |
| 275 | 0.9 | 190 | 64/63/63 | 210 |
| 265 | 0.7 | 189 | 63/63/63 | 210 |
| 255 | 0.6 | 187 | 63/62/62 | 200 to 210 |
| 245 | 0.4 | 186 | 62/62/62 | 200 |
| 235 | 0.4 | 184 | 62/61/61 | 200 |
| 225 | 0.3 | 183 | 61/61/61 | 200 |
| 215 | 0.3 | 181 | 61/60/60 | 200 |
| 205 | 0.2 | 180 | 60/60/60 | 200 |
Percentiles and old GMAT equivalents are from GMAC's Total Score Concordance Table, published August 2026 (GMAC, 2026). Section sums and splits are OnePrep's calculation from the pattern above; any split with the same sum gives the same total.
GMAT section percentiles for 2027
Section percentiles are where the three sections stop looking alike. The same score can sit at very different percentiles, because fewer test takers reach the top of some sections than others.
| Section score | Quant percentile | Verbal percentile | Data Insights percentile (approx.) |
|---|---|---|---|
| 90 | 100.0 | 100.0 | 100 |
| 89 | 96.6 | 99.0 | 100 |
| 88 | 95.4 | 98.4 | 99 |
| 87 | 93.4 | 97.4 | 99 |
| 86 | 90.9 | 95.7 | 99 |
| 85 | 87.8 | 92.6 | 98 |
| 84 | 84.6 | 87.3 | 97 |
| 83 | 80.1 | 81.1 | 95 |
| 82 | 75.3 | 72.9 | 93 |
| 81 | 69.8 | 64.3 | 89 |
| 80 | 63.9 | 54.4 | 83 |
| 79 | 57.3 | 46.0 | 76 |
| 78 | 50.2 | 37.7 | 69 |
| 77 | 43.4 | 29.9 | 62 |
| 76 | 37.7 | 23.0 | 53 |
| 75 | 32.6 | 18.2 | 47 |
| 74 | 27.6 | 14.0 | 41 |
| 73 | 23.4 | 10.5 | 35 |
| 72 | 19.9 | 7.8 | 29 |
| 71 | 16.6 | 5.8 | 25 |
| 70 | 13.8 | 4.3 | 21 |
| 69 | 11.4 | 3.4 | 17 |
| 68 | 9.1 | 2.8 | 14 |
| 67 | 7.2 | 2.2 | 12 |
| 66 | 5.4 | 1.8 | 10 |
| 65 | 4.1 | 1.5 | 8 |
| 64 | 3.1 | 1.3 | 7 |
| 63 | 2.4 | 1.1 | 6 |
| 62 | 1.8 | 0.9 | 5 |
| 61 | 1.4 | 0.8 | 4 |
| 60 | 1.0 | 0.7 | 4 |
Quant and Verbal figures are GMAC's August 2026 concordance tables (GMAC Quant, GMAC Verbal, 2026). GMAC publishes no Data Insights concordance table, since Data Insights has no old GMAT section to compare against, so the Data Insights column is approximate, based on GMAC's previous percentile release and rounded to whole numbers. Your official score report shows the exact current figure.
The total counts points, not percentiles. A Verbal 85 (92.6th percentile) and a Data Insights 85 (about the 98th) add exactly the same 85 to your section sum.
How does a GMAT Focus score compare with the old GMAT?
You cannot compare the two scales number for number. GMAC says comparing total or section scores across the editions "is not appropriate, accurate, or a meaningful comparison of performance", and recommends comparing percentiles instead (mba.com, 2026). Its concordance table does exactly that. Here is where the old scores applicants still quote land today:
| Old GMAT score | GMAT Focus equivalent |
|---|---|
| 760 | 715 to 735 |
| 750 | 695 to 715 |
| 740 | 685 to 695 |
| 730 | 675 to 685 |
| 720 | 665 to 675 |
| 710 | 655 to 665 |
| 700 | 645 to 655 |
| 690 | 635 to 645 |
| 680 | 615 to 635 |
| 650 | 595 to 615 |
| 600 | 555 to 565 |
| 550 | 515 to 525 |
Equivalents are from GMAC's Total Score Concordance Table, August 2026 (GMAC, 2026). A range means several current totals share the same old-scale percentile band. If a school's class profile still quotes an old-scale average, convert it here before setting your target.
When do GMAT percentiles change?
GMAC updates its percentile tables every year in the third quarter (GMAC, 2026). The current tables, published in August 2026, are based on test takers between 1 July 2021 and 30 June 2026. The same total can therefore sit at a slightly different percentile from one year to the next, even though the score itself never changes.
The quickest way to see where you sit on this chart is a full-length test. Start your free mock today and you get a total and three section scores on the same scale, ready to look up here.
Frequently asked questions
Which GMAT percentiles apply to 2027 applications?
GMAC's August 2026 tables, covering test takers from July 2021 to June 2026. They stay in use until GMAC's next annual update, usually in the third quarter, so this chart is the one to use for 2027 applications until then.
What percentile is a 655 on the GMAT?
The 89.6th percentile on GMAC's August 2026 table. A 645 is the 85.6th and a 665 the 91.2nd.
Can you score 700 on the GMAT?
No. Every GMAT Focus total ends in 5, so the scores either side of 700 are 695 (96.9th percentile) and 705 (97.5th).
What is an old 700 GMAT score in GMAT Focus terms?
645 to 655. On GMAC's August 2026 concordance table, an old 700 sits at the same percentile as those two current totals.
What is the median GMAT score?
About 560 on the current scale. A 555 is the 47.4th percentile and a 565 the 50.4th, so the middle test taker falls between them.
Why is there no official Data Insights percentile table?
GMAC's concordance tables link current scores to the old exam, and Data Insights has no old-exam section to link to. Your official score report still shows your Data Insights percentile.
When is the next GMAT percentile update?
GMAC updates percentiles every year in the third quarter, so expect the next tables around July to September 2027.
Sources
About the author
Rama Negi
Admission Specialist at oneprep.in
15+ years teaching GMAT and counselling MBA applicants; 5 years with OnePrep.
More articles by Rama NegiRelated reading
Start your free mock today
Find out exactly where you stand, and let your scores guide your next step.